Book a Consultation
HomeSolutionsPackaging Line Downtime Visibility
Solution blueprint

Packaging Line Downtime Visibility

A blueprint for making packaging stoppages, jams, rejects, setup losses, and hidden downtime visible enough for operator and maintenance action.

Operating problem

Packaging lines often lose capacity through short stops, jams, rejects, air or photoeye problems, setup losses, and manual recovery. The problem is not only downtime measurement; it is whether the line state and stop reason are trusted enough to drive action.

How to read this blueprint Stop-reason structures, OEE concepts, and event maps here are field-tested patterns for designing your own downtime programme. Your line's reason codes, station boundaries, and operator workflow should drive the final design.
Packaging Line Downtime Visibility blueprint video poster
01:00 visual explainer brief: Explain how packaging-line stops become useful only when line state, stop reason, event evidence, and action review are trusted.
Symptoms and decision signals

What usually tells the team the problem is real

Untrusted stop reasons

The dashboard says the line stopped, but operators and maintenance disagree about the true cause.

Short stops disappear

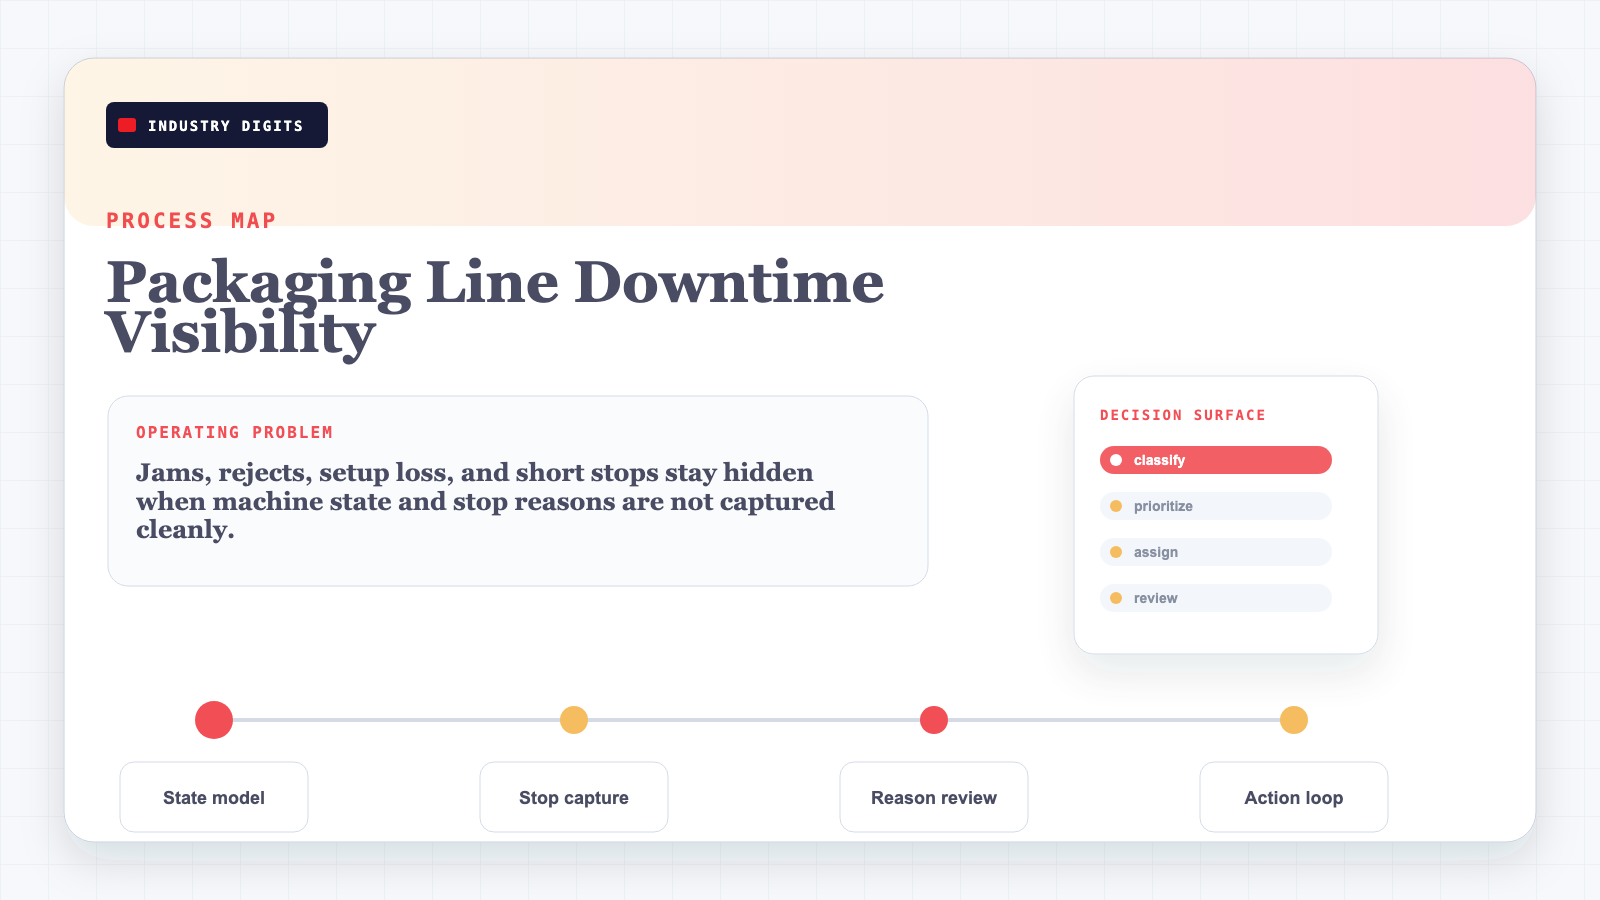
Small jams, sensor trips, and resets accumulate into lost capacity without clear event history.

Manual logs lag reality

Operators record reasons after the fact, which weakens root-cause review and shift handover.

Controls state is unclear

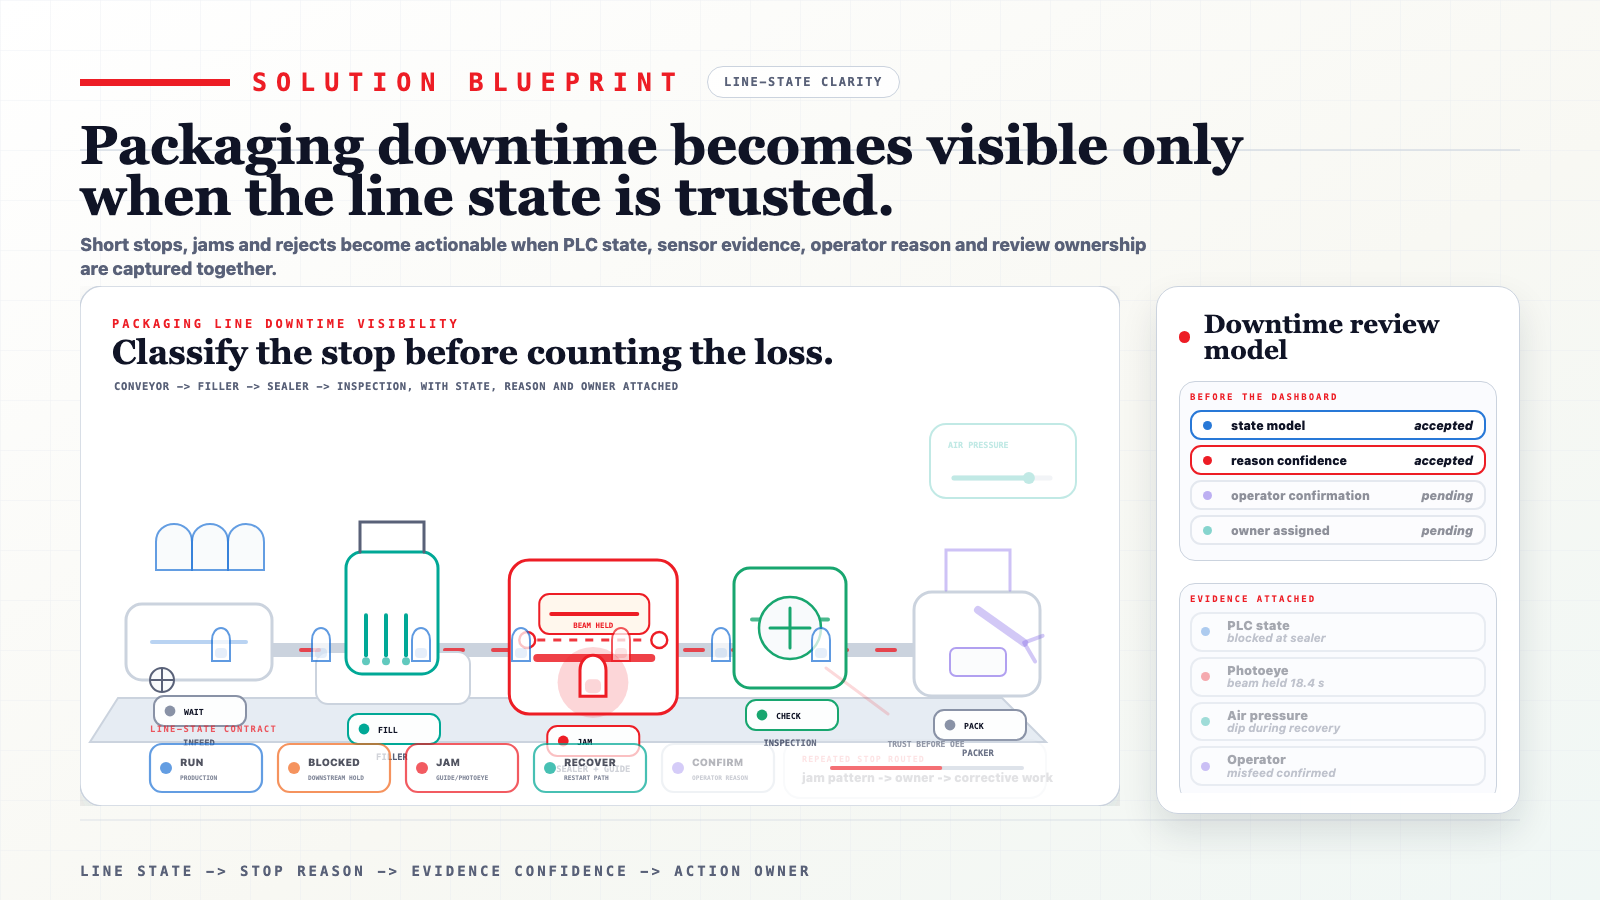
PLC and HMI states do not cleanly separate running, held, faulted, starved, blocked, setup, and manual recovery.

Why common approaches fail

Useful technology fails when the operating decision is undefined

Generic OEE screen A high-level OEE dashboard appears before line states and stop-reason trust are fixed.
Weak PLC state model Control logic does not distinguish production, setup, fault, blocked, starved, quality hold, and manual recovery.
No operator action loop Stop reasons are collected but not reviewed with operators, maintenance, and shift leaders.
Event volume without priority Every sensor trip becomes data, but the line has no rule for which events deserve action.
Packaging line event process map from line state to stop reason, review, and corrective action
Process map: how the issue moves from signal evidence to review and action.
Packaging line downtime visibility architecture showing PLC and HMI states, events, stop reasons, dashboard, and action loop
Architecture view: sources, data path, decision surface, and owner-backed action.
Solution architecture

What has to connect before scaling

Line-state model Define production, stop, blocked, starved, setup, fault, manual, and quality-hold states.
Event capture Capture PLC/HMI states, photoeye events, reject counts, drive or motor current, air pressure, and operator reason confirmation.
Downtime model Convert raw events into trusted stop categories, duration bands, repeat patterns, and action owners.
Action loop Close the review through operator coaching, maintenance work, controls cleanup, or setup discipline.
30 / 60 / 90 day path

A release path that earns trust before scale

These stages are planning ranges. The real cadence depends on plant access, signal quality, risk, and ownership.

30 days

Map line states and stop taxonomy

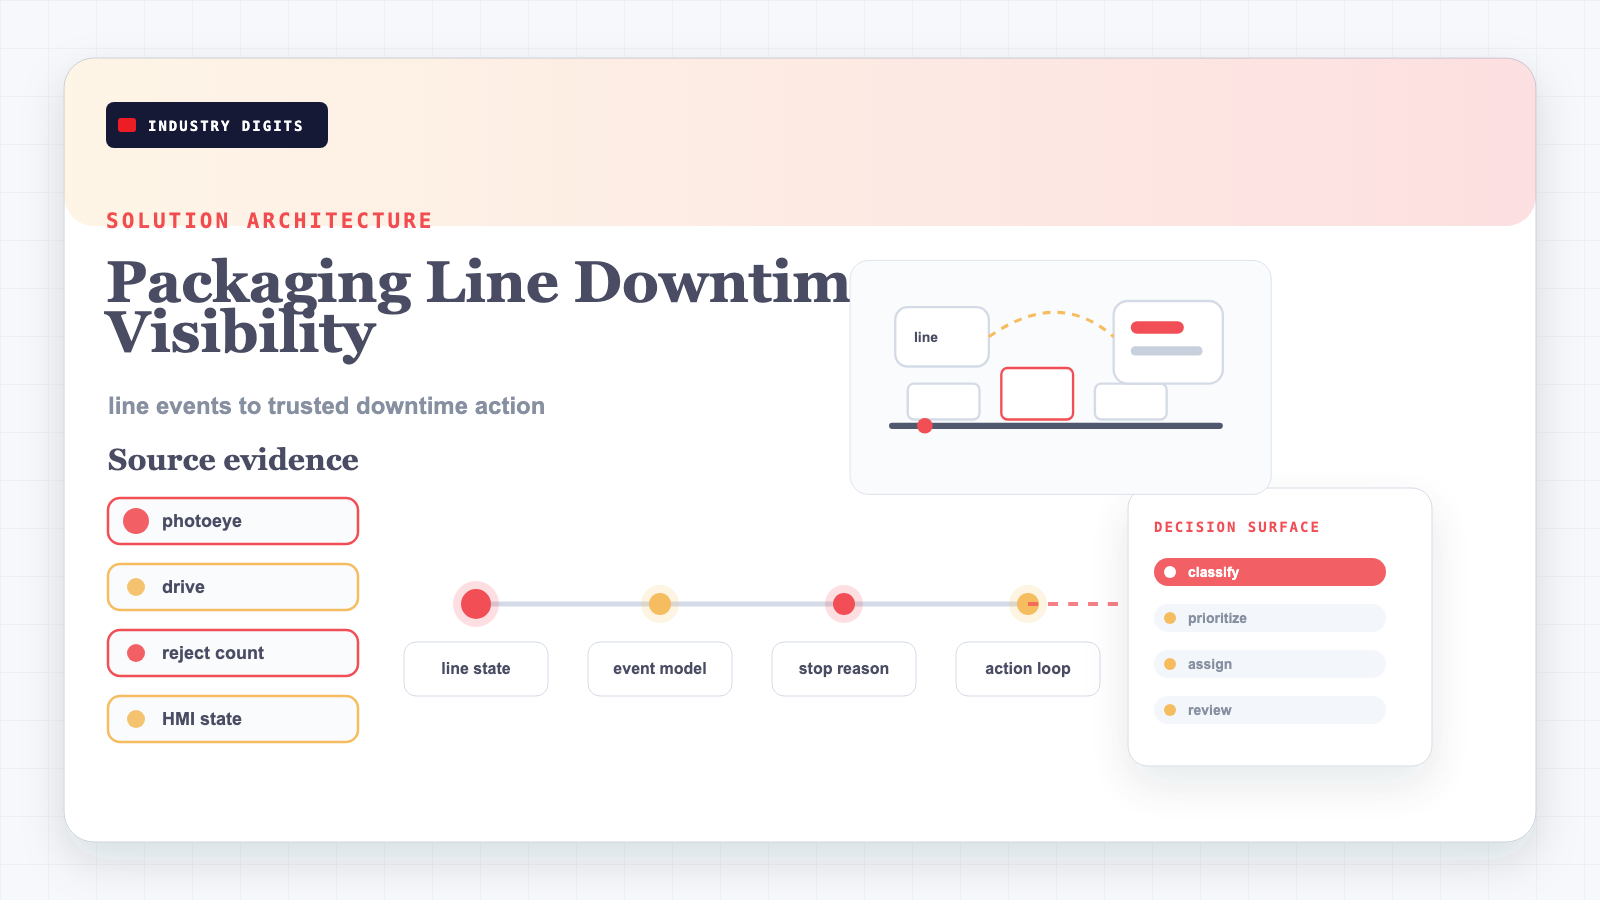
Review PLC/HMI behavior, known stoppages, manual logs, operator language, and event sources for one packaging line.

60 days

Build trusted stop evidence

Capture selected events, reconcile them with operators, and tune reason logic before broad reporting.

90 days

Review and improve action

Run a shift or weekly review loop and convert repeat reasons into controls cleanup, maintenance, training, or setup changes.

Required signals

The data contract is the practical proof surface.

Each signal needs ownership, unit, context, quality, and review logic. Without that contract, dashboards and alerts become fragile.

Line state Run, stop, blocked, starved, setup, fault, manual, quality hold, timestamp, and source logic owner.
Stop reason Reason code, source confidence, operator confirmation, duration, repeat count, and action owner.
Quality and rejects Reject count, reject reason if available, product/state context, and inspection or review owner.
Utility or actuator context Air pressure, drive/current, sensor trip, or actuator status with machine state and timestamp.
Explainer video brief

Packaging Line Downtime Visibility Blueprint

Explain how packaging-line stops become useful only when line state, stop reason, event evidence, and action review are trusted.

0-10s Hidden losses

Small stops can hide large capacity loss.

10-24s Line-state clarity

State clarity makes stop reasons believable.

24-42s Event model

Evidence has to map to an action owner.

42-60s Action review

Visibility earns value when the review loop changes work.

Related reading

Articles connected to this blueprint

Field guides and standards references that deepen the methods this blueprint depends on.

Food and beverage packaging line data flow diagram showing sensors, PLC states, quality checks, and dashboard evidence Industrial Automation

Food And Beverage Automation: Practical IIoT And Control Ideas For Hygienic Production Lines

How food and beverage plants can use automation, IIoT, and condition monitoring to improve uptime, hygiene, quality, and packaging reliability without overcomplicating operations.

Ladder Logic control foundation showing readable PLC logic as a base for troubleshooting, documentation, and future data quality Industrial Automation

Ladder Logic Foundations: Why PLC Thinking Still Matters In Modern Automation

A practical automation guide for leaders who need PLC logic, machine sequences, safety discipline, and future IIoT data to work as one operating system.

Industrial IoT sensor selection checklist resource cover IIoT

Industrial IoT Sensor Selection Checklist: From Field Signals To Reliable Decisions

A gated resource for selecting IIoT sensors, transducers, and switches that can survive the plant environment and support reliable operating decisions.

Decision framework separating industrial automation, IIoT, Industry 4.0, and AI as investment layers Industrial Automation

IoT, IIoT, Industry 4.0, And Industrial Automation: A Decision Framework For Industrial Leaders

A decision framework for industrial leaders who need to separate control, visibility, data, and transformation before committing capital.

Process automation control layer diagram showing instrumentation, PLC or DCS, historian, edge, and action layers Industrial Automation

Process And Chemical Automation: Control, Visibility, And Safer Decision Workflows

A practical guide to automation and IIoT for process and chemical plants, focused on control reliability, alarms, instrumentation, maintenance, and operational visibility.

Smart manufacturing blueprint showing production, maintenance, quality, utilities, and planning connected to a decision proof loop IIoT

Smart Manufacturing With IIoT: A Practical Blueprint Before You Call It Industry 4.0

A grounded smart manufacturing blueprint for connecting production, maintenance, quality, utilities, and planning without overclaiming transformation.

Ready to see what automation could do for your plant?

Discuss Your Project